

[The World of Linkers—Theory 11] Teaching Machine Code to Remember Its Source
The filenames in the commands below are placeholders for the inputs and outputs of this observation; choose any working directory.
Debug information describes a program: it associates machine addresses with names, types, and source lines. The CPU normally does not execute these records. Relocation from Theory 04 and section removal from Theory 05 lead to the central question: what should happen to a description when its code moves or disappears?
Start with the deleted-function example and debug relocations, identifying what each record describes and what its addresses refer to. DWARF type trees and line programs organize different parts of that description. Compression, separate debug files, and split DWARF address size and distribution; they can be read independently after the address relationships are clear. The full DWARF standard is not a prerequisite.
A function disappears from an executable. Should the debugger still know its name?
Section garbage collection can remove the machine code while leaving behind its name, type, source lines, and address records. Some of that information remains useful. Some becomes misleading unless the linker marks it correctly. Running the program will rarely expose the difference; asking the debugger about the wrong address will.
This chapter follows those references from object file to debugger. The central question is not whether a file contains debug information, but whether that information still describes the program that actually exists.
A function with a name but no address
Compile each function into a separate section, then enable section GC1. No live code calls unused:
// gc.cint counter = 1;
__attribute__((noinline)) int used(int x) { return x + counter;}
__attribute__((noinline)) int unused(int x) { return x * 3 + counter;}
void _start(void) { int r = used(41); __asm__ volatile("mov %0, %%edi; mov $60, %%eax; syscall" :: "r"(r) : "rdi", "rax");}Compile and link the program through Clang/LLD and GCC/GNU ld to compare how their output describes the same source.
$ clang -O1 -g -ffunction-sections -fno-pic \ -fno-asynchronous-unwind-tables -c gc.c -o gc_clang.o$ gcc -O1 -g -ffunction-sections -fno-pic \ -fno-asynchronous-unwind-tables -c gc.c -o gc_gcc.o$ ld.lld --gc-sections gc_clang.o -o lld.out$ ld --gc-sections gc_gcc.o -o bfd.outThe comparison also maps the build directory to /w with -fdebug-prefix-map. This reduces build-directory differences in matching debug paths. It does not fix every file byte or section offset: compiler versions, options, and other metadata still affect the output. The recorded results come from the supplied script; when following the simplified commands above, compare the relationships between records rather than expecting every offset to match.
Clang2 and GCC here default to DWARF3 5. A compilation unit, or CU, contains a tree of debugging information entries, DIEs4. A tag identifies an entity such as a function; attributes describe its name, type, and address range; forms specify how those values are encoded. For this experiment, the form determines where the linker eventually writes an address.
$ llvm-dwarfdump --debug-info lld.out | grep -E 'DW_TAG_subprogram|DW_AT_(name|low_pc|high_pc)'0x0000003e: DW_TAG_subprogram DW_AT_low_pc (0x0000000000201160) DW_AT_high_pc (0x0000000000201169) DW_AT_name ("used")0x00000058: DW_TAG_subprogram DW_AT_low_pc (0x0000000000000000) DW_AT_high_pc (0x000000000000000a) DW_AT_name ("unused")0x00000072: DW_TAG_subprogram DW_AT_low_pc (0x0000000000201170) DW_AT_high_pc (0x0000000000201188) DW_AT_name ("_start")The function's DIE survives, but its start address becomes zero. The encoded high_pc is a length, so the displayed interval is [0, 0xa). GCC's version is 0xe bytes long because this build emits an endbr64 instruction. Equal tombstone policy does not imply equal generated code.
GCC uses a direct DW_FORM_addr value in .debug_info. Clang uses an index, DW_FORM_addrx, into .debug_addr.
Three numbers in the following header describe different dimensions. version=5 is the DWARF version. DWARF32 selects 32-bit length/section-offset encoding for these records. addr_size=8 means each address occupies eight bytes. DWARF32 can describe a 64-bit program; it does not restrict addresses to four bytes. Length encoding delimits records, while address size determines how to read address entries:
$ llvm-dwarfdump --debug-addr lld.outAddress table header: length = 0x0000002c, format = DWARF32, version = 0x0005, addr_size = 0x08, seg_size = 0x00Addrs: [0x00000000002021880x00000000002011600x00000000000000000x00000000002011700x000000000020117b]The five entries describe counter, used, unused, _start, and a position inside _start. The third entry is the zeroed address. The line table independently retains a sequence for the deleted function:
$ llvm-dwarfdump --debug-line lld.outAddress Line Column File ISA Discriminator OpIndex Flags------------------ ------ ------ ------ --- ------------- ------- -------------0x0000000000201160 3 0 0 0 0 0 is_stmt0x0000000000201162 4 14 0 0 0 0 is_stmt prologue_end0x0000000000201168 4 5 0 0 0 00x0000000000201169 4 5 0 0 0 0 end_sequence0x0000000000000000 8 14 0 0 0 0 is_stmt prologue_end0x0000000000000003 8 18 0 0 0 00x0000000000000009 8 5 0 0 0 00x000000000000000a 8 5 0 0 0 0 end_sequence0x0000000000201170 11 0 0 0 0 0 is_stmt...A sequence starts with DW_LNE_set_address and ends with end_sequence. Here the sequence for unused also begins at zero. Both the function record and its source-line program remain, but their code address has become a tombstone.
Why not use the same tombstone everywhere?
DWARF 4 range lists use pairs of addresses. A pair of zeroes terminates the list; a start value of all ones selects a base address. Neither is an ordinary empty range. The linkers therefore use [1, 1) for a deleted range:
$ gcc -O1 -g -gdwarf-4 -ffunction-sections -fno-pic \ -fno-asynchronous-unwind-tables -c gc.c -o gc4.o$ ld.lld --gc-sections gc4.o -o lld4.out$ ld --gc-sections gc4.o -o bfd4.out$ readelf -x .debug_ranges bfd4.out 0x00000000 00104000 00000000 0d104000 00000000 ..@.......@..... 0x00000010 01000000 00000000 01000000 00000000 ................ 0x00000020 0d104000 00000000 27104000 00000000 ..@.......@..... 0x00000030 00000000 00000000 00000000 00000000 ................In the examined LLD5 implementation, most nonallocated debug references receive zero; .debug_loc and .debug_ranges receive one; .debug_names receives minus one. The implementation is in relocateNonAlloc. GNU's observed range-list behavior agrees with this fixture, though its complete policy is not identical.
This convention has history. Older LLD versions added the relocation addend to zero, turning references into small positive addresses. A June 2020 change tried minus one, with minus two where minus one already had a reserved meaning. Consumer incompatibilities led to the zero/one policy before LLD 11 shipped. The changes are recorded in e618ccbf and 004be403.
ICF6 adds another distinction: a folded function may need tombstoned metadata, but its line information must remain usable for breakpoints at the shared code. Tombstone handling is a contract with consumers, not simply a convenient constant.
Zero is a real address on some machines
For an ordinary Linux executable, zero is below the text mapping. GDB can recognize zero-address records as discarded code:
$ gdb -q -batch -ex "info line used" -ex "info line unused" ./bfd.outLine 3 of "gc.c" starts at address 0x401000 <used> and ends at 0x401004 <used+4>.Function "unused" not defined.But a linker script can place real text at zero. Firmware often does exactly that. Reuse the same object and change only placement:
$ ld --gc-sections -Ttext=0 gc_gcc.o -o bfd0.out$ nm bfd0.out | grep ' T '000000000000000d T _start0000000000000000 T used$ addr2line -f -e bfd0.out 0x4used/w/gc.c:8Address 0x4 belongs to used, yet the reported line comes from unused. Two line sequences now overlap:
$ llvm-dwarfdump --debug-line bfd0.outAddress Line Column File ISA Discriminator OpIndex Flags------------------ ------ ------ ------ --- ------------- ------- -------------0x0000000000000000 3 43 1 0 0 0 is_stmt0x0000000000000000 3 43 1 0 0 00x0000000000000004 4 5 1 0 0 0 is_stmt0x0000000000000004 4 14 1 0 0 00x000000000000000c 5 1 1 0 0 00x000000000000000d 5 1 1 0 0 0 end_sequence0x0000000000000000 7 45 1 0 0 0 is_stmt0x0000000000000000 7 45 1 0 0 00x0000000000000004 8 5 1 0 0 0 is_stmt0x0000000000000004 8 14 1 0 0 00x0000000000000007 8 18 1 0 0 00x000000000000000d 9 1 1 0 0 00x000000000000000e 9 1 1 0 0 0 end_sequence0x000000000000000d 11 19 1 0 0 0 is_stmt0x0000000000000011 12 5 1 0 0 0 is_stmt0x0000000000000011 12 13 1 0 0 00x000000000000001d 13 5 1 0 0 0 is_stmt0x0000000000000026 14 1 1 0 0 00x0000000000000027 14 1 1 0 0 0 end_sequenceGDB's checks ask whether any loaded section really begins at zero and whether a zero line-sequence start lies below the CU's code. Neither check rules out the tombstone in this fixture:
$ gdb -q -batch -ex "info line used" -ex "info line unused" -ex "info line *0x4" ./bfd0.outLine 7 of "gc.c" starts at address 0x0 <unused> and ends at 0x4 <unused+4>.Line 7 of "gc.c" starts at address 0x0 <unused> and ends at 0x4 <unused+4>.Line 8 of "gc.c" starts at address 0x4 <unused+4> and ends at 0xc <unused+12>.LLD can override dead nonallocated relocations for this experiment:
$ ld.lld --gc-sections --image-base=0 -Ttext=0 \ -z dead-reloc-in-nonalloc='.debug_*=0xffffffffffffffff' gc_gcc.o -o lldm1.out$ addr2line -f -e lldm1.out 0x4used/w/gc.c:4With all-ones tombstones, the correct line returns. LLVM's7 DWARF reader and GDB recognize that value for the tested records. This is a targeted demonstration, not a recommendation to replace every default tombstone indiscriminately: list formats and consumer compatibility still constrain the choice.
A dead function versus a dead input file
A linker can discard debug information at coarser granularity without rewriting every DIE. The examined GNU linker removes an input file's debug sections if all its relevant allocated sections are dead. LLD retains the extra CU in this test:
$ ld --gc-sections --print-gc-sections gc_gcc.o dead_gcc.o -o bfd2.outld: removing unused section '.text.unused' in file 'gc_gcc.o'ld: removing unused section '.text.orphan' in file 'dead_gcc.o'ld: removing unused section '.debug_info' in file 'dead_gcc.o'ld: removing unused section '.debug_abbrev' in file 'dead_gcc.o'...ld: removing unused section '.debug_frame' in file 'dead_gcc.o'$ ld.lld --gc-sections gc_gcc.o dead_gcc.o -o lld2.outGNU's .debug_info is 234 bytes, with only gc.c; LLD's is 336 bytes, also containing dead.c and orphan. Both still retain the tombstone for unused in the live file.
Removing individual dead DIEs requires understanding references within DWARF and rebuilding offsets. A specialized post-link tool such as llvm-dwarfutil can do that. Ordinary ELF relocation processing need not become a complete semantic DWARF editor.
What the linker actually sees
$ readelf -SW lld.out [Nr] Name Type Address Off Size ES Flg Lk Inf Al [ 0] NULL 0000000000000000 000000 000000 00 0 0 0 [ 1] .text PROGBITS 0000000000201160 000160 000028 00 AX 0 0 16 [ 2] .data PROGBITS 0000000000202188 000188 000004 00 WA 0 0 4 [ 3] .debug_loclists PROGBITS 0000000000000000 00018c 00001d 00 0 0 1 [ 4] .debug_abbrev PROGBITS 0000000000000000 0001a9 000099 00 0 0 1 [ 5] .debug_info PROGBITS 0000000000000000 000242 000095 00 0 0 1 [ 6] .debug_rnglists PROGBITS 0000000000000000 0002d7 00001a 00 0 0 1 [ 7] .debug_str_offsets PROGBITS 0000000000000000 0002f1 000030 00 0 0 1 [ 8] .debug_str PROGBITS 0000000000000000 000321 000052 01 MS 0 0 1 [ 9] .debug_addr PROGBITS 0000000000000000 000373 000030 00 0 0 1 [10] .comment PROGBITS 0000000000000000 0003a3 000042 01 MS 0 0 1 [11] .debug_frame PROGBITS 0000000000000000 0003e8 000068 00 0 0 8 [12] .debug_line PROGBITS 0000000000000000 000450 00009b 00 0 0 1 [13] .debug_line_str PROGBITS 0000000000000000 0004eb 000008 01 MS 0 0 1 [14] .symtab SYMTAB 0000000000000000 0004f8 000078 18 16 2 8 [15] .shstrtab STRTAB 0000000000000000 000570 0000bd 00 0 0 1 [16] .strtab STRTAB 0000000000000000 00062d 00001a 00 0 0 1$ readelf -lW lld.out Section to Segment mapping: Segment Sections... 00 01 02 .text 03 .data 04The .debug_* sections have no SHF_ALLOC, their output addresses are zero, and no load segment contains them. A debugger reads them from the file; they consume no process mapping. .debug_str and .debug_line_str also carry mergeable-string flags.
The main sections divide the work:
| Section | Information |
|---|---|
.debug_info | DIE trees |
.debug_abbrev | Shared descriptions of DIE attributes and their forms |
.debug_str, .debug_line_str | Attribute strings and line-table strings |
.debug_line | Address-to-source-line state machines |
.debug_rnglists, .debug_loclists | DWARF 5 ranges and changing variable locations |
.debug_frame | Debugging call-frame information |
.debug_addr, .debug_str_offsets | Indexed address and string-offset tables |
File growth is separate from loading
Program headers and section headers are two directories for the same ELF file. Section headers from Theory 02 describe sections; PT_LOAD from Theory 06 defines loading ranges and permissions. A section can occupy real file bytes without belonging to a load segment.
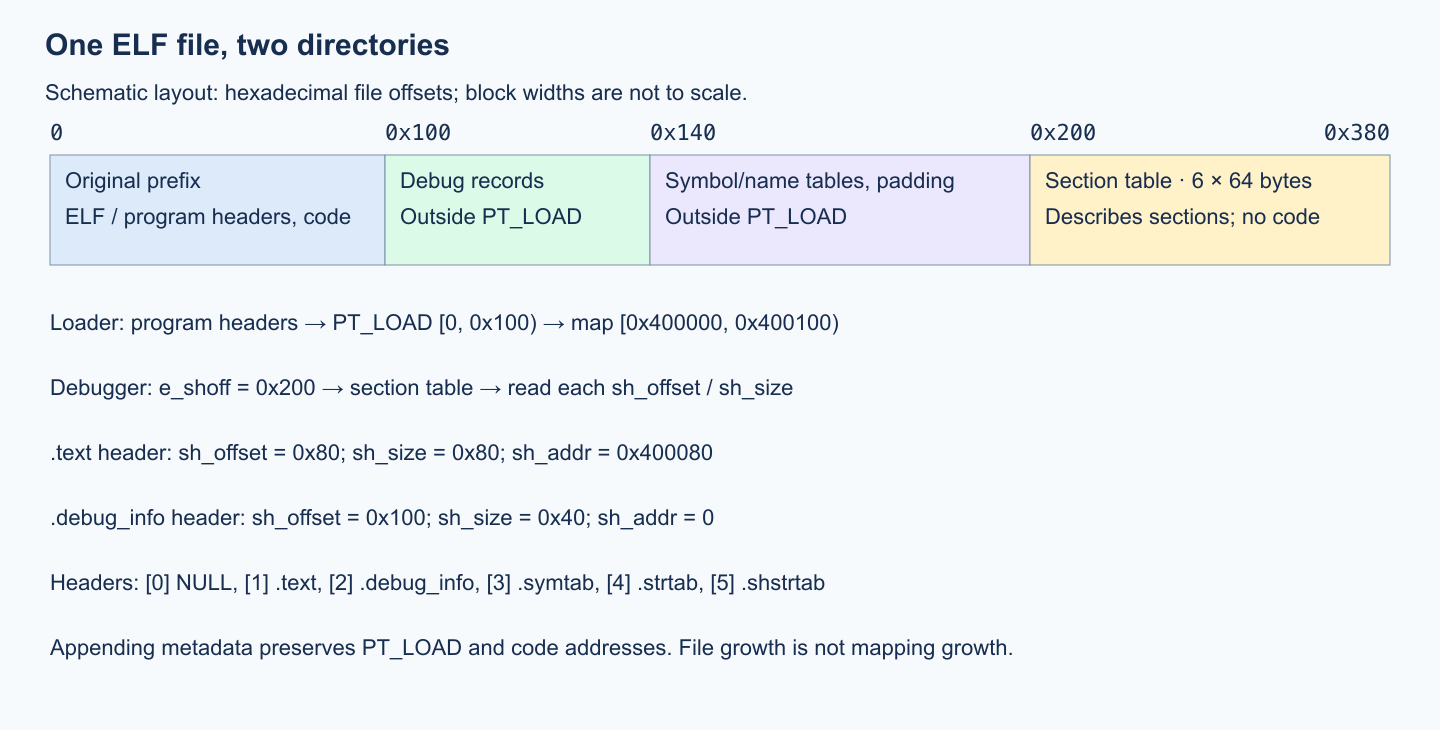
In this schematic, the original prefix ends at 0x100. An RX segment maps file bytes [0, 0x100) at [0x400000, 0x400100). Existing .text occupies [0x80, 0x100) and starts at address 0x400080. Debug records, symbol/name tables, and six section headers can be appended without moving that code. The section table occupies [0x200, 0x380), with e_shoff=0x200. Its .text entry still describes [0x80, 0x100); its .debug_info entry describes the new range [0x100, 0x140).
The new debug section has sh_addr=0 and lies outside every load segment. A debugger finds its bytes through sh_offset and sh_size. Code addresses within those bytes describe existing instructions; they do not request that the debug records themselves be loaded there. The symbol table's sh_link selects .strtab for symbol names, whereas each section header's sh_name refers to .shstrtab. Offsets into these two string tables are not interchangeable.
A linker may plan allocated and non-allocated sections together from the start. Appending metadata to an already laid-out image is another valid organization, provided it preserves the existing program headers, entry, code, and data, and excludes the added debug bytes from p_filesz and p_memsz. Updating the section directory does not expand a mapping; growing the disk file does not change program-header fields. Successful execution and correct debugger interpretation therefore require separate verification.
Separate the patch location from the value being written
A debug relocation names both a source field and a target. r_offset locates the field within its input section. The symbol and addend identify what that field refers to. These two input contributions can move independently, so each needs its own coordinate conversion.
Consider a schematic layout that concatenates inputs without deduplication. Both a.o and b.o contribute 32 bytes of .debug_info; the second contribution starts at output offset 32. Their .debug_str inputs contain four bytes a\0b\0 and eight bytes cat\0dog\0, respectively. Both have alignment 1, so the second string contribution starts at output offset 4. A code section from b.o receives virtual address 0x401020. Suppose two fields in b.o's .debug_info require relocation:
| Input field | Relocation | Target's output coordinate | Value and little-endian bytes |
|---|---|---|---|
| Offset 8, four bytes | R_X86_64_32 against the .debug_str section symbol, st_value=0, A=4 | String contribution start 4, plus 4 bytes to reach dog | 8 → 08 00 00 00 |
| Offset 12, eight bytes | R_X86_64_64 against the code section symbol, st_value=0, A=4 | Code start 0x401020, plus 4 bytes | 0x401024 → 24 10 40 00 00 00 00 00 |
Write the first field at output .debug_info[40..44], since 32 + 8 = 40; write the second at [44..52], since 32 + 12 = 44. A helper operating on a mutable slice of the second input's contribution still uses the original offsets 8 and 12. A helper operating on the whole output section must add the contribution start 32. Both designs work; mixing them adds that start twice.
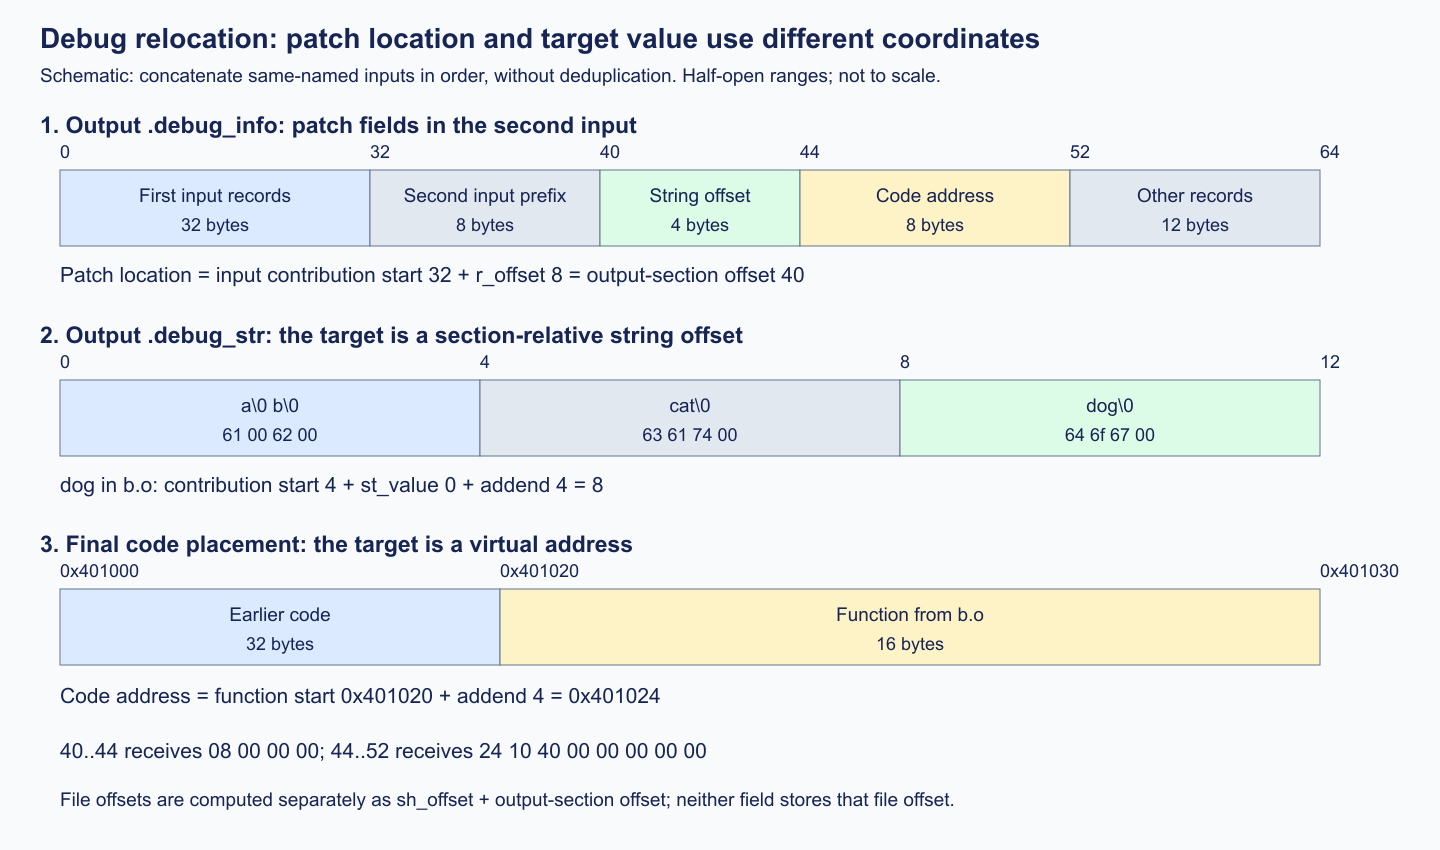
None of these section offsets is yet a file offset. If output .debug_info has sh_offset=F, the first field's file position is F + 40, while the value stored there remains string offset 8. The debugger uses a section header to find .debug_str in the file, then advances eight bytes from that section's start. The code-address field instead describes a location in the program's address space.
Width and meaning are separate dimensions. This example stores a string offset in four bytes and an address in eight, but R_X86_64_32 or R_X86_64_64 alone does not determine the meaning. The relocation kind supplies the calculation and representable range; the target section and DWARF form determine interpretation. String deduplication replaces the simple 4 + 4 translation with an input-to-output piece mapping. Deleted code requires the relevant record's tombstone convention, rather than arithmetic using a code base that no longer exists. Chapter 7 of the DWARF 5 standard specifies the reference forms.
For PIE, distinguish a link-time image address from its runtime address. A zero-based image may store code coordinate 0x1024 in DWARF; load bias 0x55550000 makes its runtime address 0x55551024. That bias applies to addresses in this image, not to offsets into .debug_str. More generally, ELF load bias is the difference between runtime and link-time virtual addresses; ET_DYN does not require every image to use a zero-based link layout.
Being nonallocated does not make these bytes location-independent:
$ llvm-readelf -rW gc_clang.oRelocation section '.rela.debug_info' at offset 0x5c8 contains 6 entries:0000000000000008 000000060000000a R_X86_64_32 0000000000000000 .debug_abbrev + 00000000000000011 000000080000000a R_X86_64_32 0000000000000000 .debug_str_offsets + 80000000000000015 0000000c0000000a R_X86_64_32 0000000000000000 .debug_line + 00000000000000023 0000000a0000000a R_X86_64_32 0000000000000000 .debug_addr + 80000000000000027 000000070000000a R_X86_64_32 0000000000000000 .debug_rnglists + c000000000000002b 000000050000000a R_X86_64_32 0000000000000000 .debug_loclists + cRelocation section '.rela.debug_str_offsets' at offset 0x658 contains 10 entries:0000000000000008 000000090000000a R_X86_64_32 0000000000000000 .debug_str + 0000000000000000c 000000090000000a R_X86_64_32 0000000000000000 .debug_str + 27...Relocation section '.rela.debug_addr' at offset 0x748 contains 5 entries:0000000000000008 0000000f00000001 R_X86_64_64 0000000000000000 counter + 00000000000000010 0000000200000001 R_X86_64_64 0000000000000000 .text.used + 00000000000000018 0000000300000001 R_X86_64_64 0000000000000000 .text.unused + 00000000000000020 0000000400000001 R_X86_64_64 0000000000000000 .text._start + 00000000000000028 0000000400000001 R_X86_64_64 0000000000000000 .text._start + bRelocation section '.rela.debug_frame' at offset 0x7c0 contains 6 entries:000000000000001c 0000000b0000000a R_X86_64_32 0000000000000000 .debug_frame + 00000000000000020 0000000200000001 R_X86_64_64 0000000000000000 .text.used + 00000000000000034 0000000b0000000a R_X86_64_32 0000000000000000 .debug_frame + 00000000000000038 0000000300000001 R_X86_64_64 0000000000000000 .text.unused + 0...Relocation section '.rela.debug_line' at offset 0x850 contains 5 entries:0000000000000022 0000000d0000000a R_X86_64_32 0000000000000000 .debug_line_str + 0000000000000002e 0000000d0000000a R_X86_64_32 0000000000000000 .debug_line_str + 30000000000000048 0000000200000001 R_X86_64_64 0000000000000000 .text.used + 00000000000000066 0000000300000001 R_X86_64_64 0000000000000000 .text.unused + 00000000000000080 0000000400000001 R_X86_64_64 0000000000000000 .text._start + 0There are two important target categories. An R_X86_64_64 targeting text or data usually needs a final virtual address. An R_X86_64_32 targeting another debug section usually needs an offset within the combined output section. Both use S + A; the meaning of S follows the target's output placement. A nonallocated output section has address zero, so an input contribution's placement becomes an output-relative offset.
Mergeable strings need more than a fixed section-base adjustment. An input addend selects a string fragment; that fragment may move independently when duplicate strings are merged. In this object, gc.c moves from input offset 0x27 to output offset 0x8:
$ llvm-readelf -x .debug_str_offsets lld.out0x00000000 2c000000 05000000 1d000000 08000000 ,...............0x00000010 0d000000 00000000 10000000 4d000000 ............M...0x00000020 46000000 16000000 14000000 44000000 F...........D...The first eight bytes are the table header. The second string entry therefore changes to 0x8. LLD's default merge implementation partitions strings by hash and combines the partitions, so even a single input may emerge in a different order. All references must follow the mapping. Simply adding the old offset to a new section start would point into an unrelated string.
A TLS location identifies a thread's copy
A TLS variable has a distinct instance in each thread. The linker determines its offset within the owning module's TLS layout; the debugger must also find that module's storage block for the selected thread. Theory 09 explains the template and its per-thread copies.
Suppose the module offset is 12 and a thread's block begins at B_thread. The address is B_thread + 12. If the ABI places TP sixteen bytes after the block start, machine code can use TP-relative offset −4; the module offset remains 12. Neither value is a PIE image RVA, and adding the image's load bias cannot locate a thread's copy.
A common ELF x86-64 location expression pushes the module offset with DW_OP_const8u, then converts it with DW_OP_form_tls_address. Here is the complete ten-byte expression for an eight-byte, little-endian operand; the surrounding DWARF attribute's form and length are excluded:
| Expression bytes | Encoding | Meaning |
|---|---|---|
0 | 0e | DW_OP_const8u: push the following eight-byte constant |
1..8 | 0c 00 00 00 00 00 00 00 | Module TLS offset 12 |
9 | 9b | DW_OP_form_tls_address: obtain the selected thread's address through the runtime environment |
A DTPOFF relocation can supply the constant in the object file. An ELF STT_TLS symbol likewise stores a TLS offset in st_value, rather than an ordinary image address.
The expression's owning executable or shared library identifies the module. The debugger still needs the runtime's TLS-discovery mechanism to find that module's block in the selected thread. This dependency is part of the semantics: DWARF does not prescribe one block-discovery algorithm for every platform. See DWARF 5, §2.5.1.4.
DWARF 5 changes where the relocations live
In this example, DWARF32 section offsets occupy four bytes and addresses occupy eight. Separate an attribute's meaning from its form: a name attribute must yield a string, and an address attribute must yield a machine address. The form determines whether the DIE stores a direct value or an index used to find it.
| Form | Stored in the DIE | How the value is obtained |
|---|---|---|
| DW_FORM_strp | Four-byte offset into .debug_str | Read the string there through its NUL terminator |
| DW_FORM_addr | Eight-byte address | Use the relocated address directly |
| DW_FORM_strx | String-table index; width depends on the specific form | Read an offset from .debug_str_offsets, then visit .debug_str |
| DW_FORM_addrx | Address-table index; width depends on the specific form | Read an address from .debug_addr |
DWARF 4 strp and addr place a relocatable field in each DIE using them. DWARF 5 indexed forms allow several DIEs to share table entries, concentrating relocations in those tables. An index is neither an address nor a string-byte offset. DW_AT_str_offsets_base and DW_AT_addr_base locate the CU's entry areas. Here each is +8 after the corresponding header, not an offset from the beginning of the ELF file.
Trace string index 1 through the output .debug_str_offsets shown above:
| Step | Value | Relative to |
|---|---|---|
| CU string-entry base | 8 | Beginning of .debug_str_offsets |
| Entry 1 position | 8 + 1 × 4 = 12 | Beginning of .debug_str_offsets |
| Four bytes 08 00 00 00 at that entry | 8 | Beginning of .debug_str |
| String obtained | gc.c | Read from .debug_str[8] through NUL |
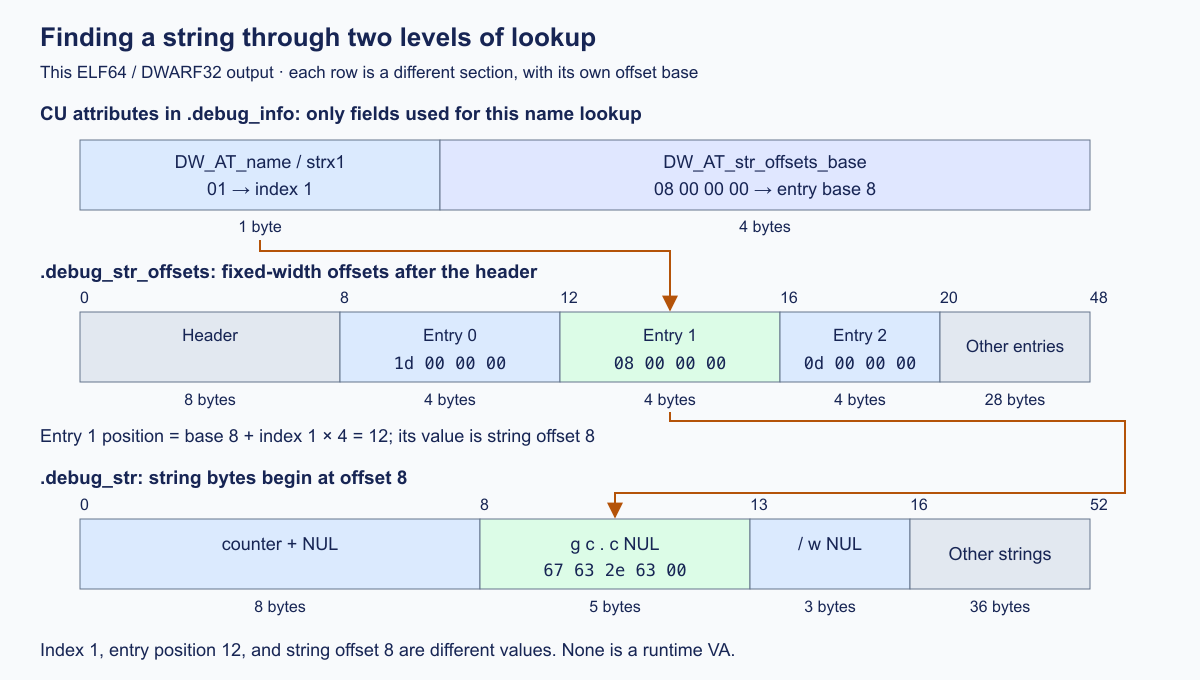
That string was at input offset 0x27 and moved to output offset 0x8. The linker updates the string offset stored in the table; a DIE using it can retain index 1. Address indices likewise add one lookup, but these address entries are eight bytes rather than four. DWARF64 changes section-offset width, so four bytes is not a universal rule. Sections 7.4 and 7.5.5 of the DWARF 5 specification define the formats and forms.
Range lists can also reuse an address table: DW_RLE_startx_length stores an address index and a range length. Reuse can reduce relocation count because one shared entry is patched once; the actual reduction depends on compiler choices and program contents.
For a larger measurement, the Linux host builds the 27 files of the RISC-V xv68 kernel, snapshot 06aad25, with Clang and -mno-relax -mabi=lp64d. Only this architecture-specific comparison targets RISC-V9; the actual debugger experiments remain native x86-64 Linux. The same environment produces comparable DWARF 4 and 5 variants:
$ sh analyze.sh--- Relocations across all 27 input objectsg0 total 1471 relocations,including .rela.debug_* 0 relocationsdw4 total 9322 relocations,including .rela.debug_* 7851 relocationsdw5 total 7895 relocations,including .rela.debug_* 6424 relocations--- By section (dw4 / dw5)[dw4]5375 .rela.debug_info2120 .rela.debug_line 350 .rela.debug_frame 6 .rela.debug_aranges[dw5]2319 .rela.debug_line2278 .rela.debug_str_offsets1329 .rela.debug_addr 350 .rela.debug_frame 142 .rela.debug_info 6 .rela.debug_arangesWithout debug information there are 1,471 relocations. DWARF 4 adds 7,851 debug relocations. Under DWARF 5, .debug_info drops from 5,375 relocations to 142, but the new tables contribute 2,278 string offsets and 1,329 addresses. Total debug relocations fall by 1,427, about 18%.
The line table grows because file and directory names now reference .debug_line_str. It also contains 1,047 pairs of RISC-V ADD16/SUB16 relocations. Those repair differences between code labels, which may change under instruction relaxation. Clang emits them even with -mno-relax in this fixture. Do not extrapolate the simpler x86-64 line tables to architectures whose linker transformations change instruction lengths.
The same build demonstrates string sharing:
--- .debug_str merging: total input / outputtotal input 16131output 4706-O2 output 4248Twenty-seven inputs repeatedly contain int, char, compiler-identification strings, directories, and common type names. Merging reduces .debug_str from 16,131 to 4,706 bytes. LLD -O2 additionally performs suffix merging: lock can refer into the end of spinlock. That saves another 458 bytes, at the cost of a different, more involved merge algorithm. Relocations must identify the selected input fragment before following its output position.
Debug information is a substantial input
$ sh analyze.shbuild-g0/kernel file 64792 bytes;0 debug sections,total 0 bytesbuild-dw4/kernel file 360792 bytes;8 debug sections,total 168795 bytesbuild-dw5/kernel file 313312 bytes;11 debug sections,total 139890 bytes...$ llvm-size -A build-g0/kernelsection size addr.text 36864 2147483648.rodata 1776 2147520512.data 4 2147522288.bss 103256 2147522304Only 38,644 bytes of text, read-only data, and initialized data need loading. The DWARF 5 debug payload is 3.6 times that size; DWARF 4 is 4.4 times it. The section breakdown shows where the reduction occurs:
[dw4] [dw5] .debug_info 66815 .debug_info 45562 .debug_abbrev 12074 .debug_abbrev 12182 .debug_aranges 144 .debug_aranges 144 .debug_line 25263 .debug_line 26874 .debug_loc 44865 .debug_line_str 674 .debug_str 4650 .debug_loclists 17037 .debug_frame 11352 .debug_str_offsets 9296 .debug_ranges 3632 .debug_str 4706 .debug_addr 10816 .debug_frame 11352 .debug_rnglists 1247Compact indexed forms and range/location encodings account for much of the 28,905-byte difference. There is also an indirect file-size cost: the DWARF 5 build's .symtab is 104,448 bytes, versus 15,192 without -g. Many extra locals exist to express the RISC-V label-difference relocations. -X, or --discard-locals, can remove those local labels from the final symbol table.
Compression belongs before or after relocation—not in the middle
The older GNU format renamed sections to .zdebug_*. The generic ELF format keeps their names and uses SHF_COMPRESSED, with a header describing the uncompressed contents:
typedef struct { Elf64_Word ch_type; // Algorithm: ELFCOMPRESS_ZLIB = 1, ELFCOMPRESS_ZSTD = 2 Elf64_Word ch_reserved; Elf64_Xword ch_size; // Uncompressed size Elf64_Xword ch_addralign; // Uncompressed alignment} Elf64_Chdr;ch_type selects zlib or zstd. The section header describes the stored compressed representation; ch_size and ch_addralign describe the expanded one. This flag cannot be combined with SHF_ALLOC or used for SHT_NOBITS; see the ELF section specification.
Compressing the same linked input gives:
$ ld.lld -z max-page-size=4096 -T kernel/kernel.ld --compress-debug-sections=zlib -o kernel-zlib build-dw5/*.o$ ld.lld -z max-page-size=4096 -T kernel/kernel.ld --compress-debug-sections=zstd -o kernel-zstd build-dw5/*.o$ llvm-readelf -SW kernel-zlib | grep ' \.debug_info ' [ 6] .debug_info PROGBITS 0000000000000000 00a768 0066c1 00 C 0 0 1$ llvm-readelf -x .debug_info kernel-zlib | head -4Hex dump of section '.debug_info':0x00000000 01000000 00000000 fab10000 00000000 ................0x00000010 01000000 00000000 78019cbd 797c1c57 ........x...y|.W$ llvm-readelf -x .debug_info kernel-zstd | head -4Hex dump of section '.debug_info':0x00000000 02000000 00000000 fab10000 00000000 ................0x00000010 01000000 00000000 28b52ffd 60fab05d ........(./.`..]The examples abbreviate the object list as build-dw5/*.o; the supplied script preserves the Makefile's actual order. The 24-byte headers identify types 1 and 2, expanded size 0xb1fa (45,562), and alignment 1. After them come the zlib stream or zstd frame.
kernel-zlib file 238320 bytes;11 debug sections,total 64902 byteskernel-zstd file 234896 bytes;11 debug sections,total 61472 bytesThe total debug payload falls to about 46% with zlib and 44% with zstd. Compression effectiveness varies by section: repeated address bytes, abbreviations, and frame patterns compress especially well. Strings have already been deduplicated, so they offer less repetition.
Inputs can be compressed too. The native assembler defaults to no compression; explicitly request it for the test object:
$ gcc -O1 -g -ffunction-sections -fno-pic -fno-asynchronous-unwind-tables \ -fdebug-prefix-map="$PWD"=/w -gz=zlib -c gc.c -o gc_gcc_z.o$ readelf -SW gc_gcc_z.o | grep -E '\.debug_.*[[:space:]][A-Z]*C[A-Z]*[[:space:]]' [10] .debug_info PROGBITS 0000000000000000 000080 000091 00 C 0 0 8 [12] .debug_abbrev PROGBITS 0000000000000000 000118 0000a2 00 C 0 0 8 [15] .debug_aranges PROGBITS 0000000000000000 0001e0 000035 00 C 0 0 8 [19] .debug_line PROGBITS 0000000000000000 000240 00007b 00 C 0 0 8 [21] .debug_str PROGBITS 0000000000000000 0002c0 0000e3 01 MSC 0 0 8 [26] .debug_frame PROGBITS 0000000000000000 000400 000040 00 C 0 0 8A flag string such as MSC means mergeable, strings, and compressed. Testing only for a standalone C token would miss it. Some small sections remain uncompressed when compression would not help.
Relocation offsets refer to expanded data. The linker must decode the header, decompress, merge and relocate, then optionally compress the output. Both tested linkers emit uncompressed output by default after reading this compressed input. Applying -gz to a compile-and-link command can therefore compress an intermediate object only for the linker to decompress it immediately.
The round trip preserves section contents:
$ llvm-objcopy --decompress-debug-sections kernel-zlib kernel-unzkernel-unz file 291560 bytes;11 debug sections,total 139890 bytesFour exported sections compare byte-for-byte with the original. The overall file nevertheless shrinks by 21,752 bytes because objcopy rebuilds and deduplicates symbol-name storage. A smaller file is not, by itself, evidence that debug information disappeared.
If no source-level debugging is wanted, -S/--strip-debug can discard it during linking:
--- -S at link time172568 bytes,.debug sections: 0This saves its headers and processing as well as its payload. .symtab remains; -s/--strip-all removes ordinary symbols too.
Separate files, one debugging session
Compression reduces distribution size. Keeping debug information outside the installed executable can avoid shipping it to machines that never need it.
Use this native Linux two-file program:
// main.c#include <stdio.h>
int add(int a, int b);
int main(void) { int s = add(40, 2); printf("%d\n", s); return 0;}// util.cint add(int a, int b) { int s = a + b; return s;}Create a debug companion and a stripped executable:
$ gcc -O0 -g main.c util.c -o prog$ mkdir -p dbg$ objcopy --only-keep-debug prog dbg/prog.debug$ objcopy --strip-debug --strip-unneeded prog dbg/prog$ objcopy --add-gnu-debuglink=dbg/prog.debug dbg/prog$ ls -l prog dbg/prog dbg/prog.debug-rwxr-xr-x 1 root root 14568 Oct 6 14:18 dbg/prog-rwxr-xr-x 1 root root 9848 Oct 6 14:18 dbg/prog.debug-rwxr-xr-x 1 root root 17696 Oct 6 14:18 prog$ readelf -SW dbg/prog.debug | grep -E '\.text|\.data |\.debug_info' [14] .text NOBITS 0000000000001060 001000 000145 00 AX 0 0 16 [25] .data NOBITS 0000000000004000 001db8 000010 00 WA 0 0 8 [29] .debug_info PROGBITS 0000000000000000 0011ee 00015e 00 0 0 1--only-keep-debug preserves code-section addresses and sizes but turns their contents into NOBITS in the companion. The debugger reads machine instructions from the executable and source metadata from the companion. --strip-unneeded also removes symbols that relocations no longer need.
Finding a companion by name
$ readelf -x .gnu_debuglink dbg/prog 0x00000000 70726f67 2e646562 75670000 43ddf805 prog.debug..C....gnu_debuglink stores a basename, a null terminator, padding to four-byte alignment, and a CRC-32 over the complete debug file. The CRC uses the executable's byte order:
$ python3 -c "import zlib; print(hex(zlib.crc32(open('dbg/prog.debug','rb').read())))"0x05f8dd43Change into dbg before opening its stripped prog. GDB recovers source lines and parameters:
$ cd dbg$ gdb -q -batch -iex "set verbose on" -ex "info line add" ./progReading symbols from ./prog...Reading symbols from <work>/gdb/dbg/prog.debug...Line 1 of "util.c" starts at address 0x1187 <add> and ends at 0x1195 <add+14>.$ gdb -q -batch -ex "break add" -ex run -ex bt ./progBreakpoint 1 at 0x1195: file util.c, line 2.
Breakpoint 1, add (a=40, b=2) at util.c:22 int s = a + b;#0 add (a=40, b=2) at util.c:2#1 0x0000555555555164 in main () at main.c:6Its documented search includes the executable directory, a .debug subdirectory, and the corresponding path beneath a global debug directory. The GDB separate-file documentation gives the full rules.
The CRC detects changes since the link was recorded. It does not prove that the debug file was originally produced with this executable. The final exercise demonstrates that distinction.
Finding a companion by build ID
A build ID identifies an output independently of its filename. The linker emits it in a GNU note:
$ readelf -n prog | grep -A1 'Build ID' Build ID: 2495a430d7ed99859a8031169dc0c57b36a5d18fThe note has name GNU, type NT_GNU_BUILD_ID (3), and identifier bytes. Strip and objcopy normally preserve it in both files. GDB searches by build ID before trying debuglink. The path uses the first two hex digits as a directory and the remaining digits as a .debug filename. Remain in dbg for these commands: extract the ID from this build's prog, create a local debug-root, and move the companion there. Do not reuse the transcript's temporary path or hash. Stop if test reports an empty ID; for an input without one, add -Wl,--build-id=sha1 to the GCC build command.
$ DEBUG_ROOT="$PWD/debug-root"$ BUILD_ID=$(LC_ALL=C readelf -n ./prog | sed -n 's/.*Build ID: //p')$ test -n "$BUILD_ID"$ ID_PREFIX=$(printf '%s' "$BUILD_ID" | cut -c1-2)$ ID_REST=$(printf '%s' "$BUILD_ID" | cut -c3-)$ mkdir -p "$DEBUG_ROOT/.build-id/$ID_PREFIX"$ mv prog.debug "$DEBUG_ROOT/.build-id/$ID_PREFIX/$ID_REST.debug"$ gdb -q -batch -iex "set debug-file-directory $DEBUG_ROOT" -iex "set verbose on" -ex "info line add" ./progReading symbols from ./prog...Reading symbols from <work>/gdb/debug-root/.build-id/24/95a430d7ed99859a8031169dc0c57b36a5d18f.debug...Line 1 of "util.c" starts at address 0x1187 <add> and ends at 0x1195 <add+14>.The absolute temporary directory in this transcript records one run. The script creates its own debug root and points GDB there, avoiding a system-directory modification. Distribution debug packages commonly install the analogous tree under /usr/lib/debug/.build-id/.
The example builds sources in a separate temporary directory and checks program output, debuglink bytes and CRC, matching build IDs in all three files, and GDB line lookup before and after moving the companion. Run it from the repository root:
the commands aboveIt verifies these two lookup paths, not every DWARF record or compression format. Addresses and hashes in transcripts belong to an example build; verification reads values from the current artifacts.
Build-ID option names are not a promise to hash the entire finished file with that named algorithm. GNU supports several strategies; availability can depend on how binutils was built. This machine's GNU ld rejected xx because its build lacked the relevant support. LLD provides these choices:
$ ld.lld --build-id=fast gc_clang.o -o bid_fast # repeat with the other three stylesBuild ID: 3766c4b8eafacf85Build ID: 45b90fa2462c4cef8a8bf744513a273fBuild ID: 2eaa355b447f5014608cb56f62da3e3670a58cf4Build ID: ac6f01e4aa68b7d753769193717cd1feThe shown fast, md5, sha1, and uuid values have lengths 8, 16, 20, and 16 bytes. UUID changes between links. In LLD 21.1.8's implementation, fast uses xxh3, while the md5 and sha1 option names select output lengths for a BLAKE3-based computation. Build IDs are artifact identifiers, not integrity signatures for arbitrary later mutations.
For lightweight backtraces, MiniDebugInfo puts a compressed miniature ELF symbol file in .gnu_debugdata. It supplies function names without full source variables and lines. At the other end, debuginfod distributes debug files and sources over HTTP by build ID. A crash collector can obtain an in-memory build ID and retrieve the matching artifact later.
Split DWARF avoids feeding most of it to the linker
Separating a debug companion after linking saves distribution space, but the linker still processed every debug byte first. Split DWARF changes the build inputs themselves:
$ gcc -O0 -g -gsplit-dwarf -c ../main.c ../util.c$ ls -l *.o *.dwo-rw-r--r-- 1 root root 1648 Oct 6 14:18 main.dwo-rw-r--r-- 1 root root 3808 Oct 6 14:18 main.o-rw-r--r-- 1 root root 1352 Oct 6 14:18 util.dwo-rw-r--r-- 1 root root 3256 Oct 6 14:18 util.o$ readelf -SW util.dwo | grep debug[ 1] .debug_info.dwo PROGBITS 0000000000000000 000040 000065 00 E 0 0 1 [ 2] .debug_abbrev.dwo PROGBITS 0000000000000000 0000a5 000060 00 E 0 0 1 [ 3] .debug_line.dwo PROGBITS 0000000000000000 000105 00005d 00 E 0 0 1 [ 4] .debug_str_offsets.dwo PROGBITS 0000000000000000 000162 000014 00 E 0 0 1 [ 5] .debug_str.dwo PROGBITS 0000000000000000 000176 0000e6 00 E 0 0 1Most source-level metadata goes into .dwo. The ordinary object retains a skeleton CU and everything whose addresses still need linking. The DWO file has no relocation sections: its indexed string references are already local, while indexed code addresses refer to a table that stays with the linked object.
$ readelf -SW util.o | grep debug [ 4] .debug_addr PROGBITS 0000000000000000 00005e 000010 00 0 0 1 [ 5] .rela.debug_addr RELA 0000000000000000 000350 000018 18 I 24 4 8 [ 6] .debug_info PROGBITS 0000000000000000 00006e 000035 00 0 0 1 [ 7] .rela.debug_info RELA 0000000000000000 000368 000090 18 I 24 6 8 [ 8] .debug_abbrev PROGBITS 0000000000000000 0000a3 000015 00 0 0 1 [ 9] .debug_gnu_pubnames PROGBITS 0000000000000000 0000b8 00001b 00 0 0 1 [10] .rela.debug_gnu_pubnames RELA 0000000000000000 0003f8 000018 18 I 24 9 8 [11] .debug_gnu_pubtypes PROGBITS 0000000000000000 0000d3 00001b 00 0 0 1 [12] .rela.debug_gnu_pubtypes RELA 0000000000000000 000410 000018 18 I 24 11 8 [13] .debug_aranges PROGBITS 0000000000000000 0000ee 000030 00 0 0 1 [14] .rela.debug_aranges RELA 0000000000000000 000428 000030 18 I 24 13 8 [15] .debug_line PROGBITS 0000000000000000 00011e 000056 00 0 0 1 [16] .rela.debug_line RELA 0000000000000000 000458 000078 18 I 24 15 8 [17] .debug_str PROGBITS 0000000000000000 000174 000028 01 MS 0 0 1 [21] .debug_line_str PROGBITS 0000000000000000 0001e8 000030 01 MS 0 0 1After linking, the skeleton names the DWO and its compilation directory:
$ gcc main.o util.o -o sp$ readelf --debug-dump=info sp | grep -E 'skeleton|dwo_name|comp_dir' | head -6 <0><14>: Abbrev Number: 1 (DW_TAG_skeleton_unit) <29> DW_AT_dwo_name : (indirect string, offset: 0): main.dwo <2d> DW_AT_comp_dir : (indirect string, offset: 0x9): <work>/gdb/sp <0><49>: Abbrev Number: 1 (DW_TAG_skeleton_unit) <5e> DW_AT_dwo_name : (indirect string, offset: 0x28): util.dwo <62> DW_AT_comp_dir : (indirect string, offset: 0x9): <work>/gdb/spAn eight-byte dwo_id checks the association. Move the DWO files away and the executable still runs, but source debugging fails:
$ mv *.dwo ../hide/$ gdb -q -batch -ex "break add" -ex run -ex bt ./sp...warning: Could not find DWO CU util.dwo(0xddb1cdcd594bf238) referenced by CU at offset 0x35 [in module <work>/gdb/sp/sp]...42[Inferior 1 (process 1645606) exited normally]No stack.This is a packaging obligation. Moving the executable without arranging access to its DWO companions discards an essential part of the debugging artifact.
The xv6 comparison quantifies the build-side effect:
--- Relocations across all 27 input objectsdw5 total 7895 relocations,including .rela.debug_* 6424 relocationssplit total 5362 relocations,including .rela.debug_* 3891 relocations--- Bytes presented to the linkerdw5 .o total 607840 bytessplit .o total 399248 bytessplit .dwo total 119576 bytesMove all DWO files away before relinking:
--- Relink the split variant after moving the .dwo files awayByte-identical to the output with the .dwo files presentThe output remains byte-identical. The linker never opened those files. Its input drops from 607,840 to 399,248 bytes, debug relocations fall from 6,424 to 3,891, and output falls from 313,312 to 224,216 bytes. This small fixture does not support a meaningful timing claim; it directly demonstrates reduced work and bytes.
The remaining debug payload is 59,856 bytes. Its largest component is still the 26,874-byte line table, followed by linked address tables and public-name/type indexes. Those indexes can help construct .gdb_index so a debugger can locate a CU without opening every DWO file.
Packaging with dwp
Many loose DWO files are inconvenient to distribute. A DWP package combines them and indexes CUs by identifier:
$ cd build-split && llvm-dwp -o kernel.dwp *.dwosplit .dwo total 119576 bytessplit .dwp 94632 bytesThe package shrinks from 119,576 to 94,632 bytes, partly by merging duplicate strings. Packaging also rebuilds string offsets and the lookup index.
A successful packaging command is not sufficient validation. With GCC 15's DWARF 5 files, GNU dwp 2.44 produced a 1,624-byte package but GDB 17.1 reported a bad DWP hash table after the loose files were removed. Rebuilding the same native example as DWARF 4 produced a 2,136-byte package from which GDB could break in add and unwind to main. This is a concrete version/input compatibility result, not a general claim that DWP or DWARF 5 cannot work.
Test the debugger's answers
A small linker should retain compatible nonallocated debug sections, place them outside PT_LOAD, and write zero output addresses. It must apply address relocations, output-relative debug offsets, and fragment-aware string relocations. It must decompress before using relocation offsets, and choose a documented tombstone policy for dead targets.
The decisive test uses a multi-file native program: break in a function from the second file, check its filename and line, inspect a recoverable parameter, and obtain the caller with bt. Begin with -O0; then verify that optimized builds report unavailable values honestly rather than expecting every source variable to survive. Compare decoded line-table relationships with a reference linker, allowing layout addresses to differ.
The preceding commands define the complete small example.
Exercises
Repeat the preceding Linux checks in a fresh temporary directory.
- Inspect compressed input. Use
gc_gcc_z.o, explicitly built with-gz=zlib:
$ readelf -tW gc_gcc_z.o [10] .debug_info PROGBITS 0000000000000000 000080 000091 00 0 0 8 [0000000000000800]: COMPRESSED ZLIB, 00000000000000ea, 1$ readelf -rW gc_gcc_z.o | sed -n "/'.rela.debug_info'/,/^$/p" | tail -200000000000000cb 0000000200000001 R_X86_64_64 0000000000000000 .text.used + 0How many stored and expanded bytes does .debug_info contain? Why can a relocation at offset 0xcb exceed its stored size? Then predict the DWO filenames produced by gcc -O0 -g -gsplit-dwarf ../main.c ../util.c -o sp2, and inspect both the directory and skeleton attributes.
- Decode a line sequence. These bytes begin at
.debug_lineoffset0x7b:
04 00 00 09 02 00 00 00 00 00 00 00 00 03 0a 0105 0d 0a 21 05 05 bb 05 01 0b 91 02 02 00 01 01Use minimum instruction length 1, initial line 1, line_base = -5, line_range = 14, and opcode_base = 13. Standard opcodes are copy (01), advance PC (02, ULEB128), advance line (03, SLEB128), set file (04), set column (05), prologue end (0a), and epilogue begin (0b). An extended opcode starts with zero, then a length and subtype; subtype 2 sets an eight-byte address and subtype 1 ends the sequence. For a special opcode, subtract 13; the quotient by 14 advances the address and the remainder minus 5 advances the line, then emit a row. The set-address relocation at offset 0x80 resolves to _start = 0x201170. What rows result?
Also decode this 24-byte compressed-section header, given stored section size 0x66c1. What percentage of the expanded size is compressed payload?
01000000 00000000 fab10000 00000000 01000000 00000000- Break the companion-file contract. Append one byte to the debug file:
$ gcc -O0 -g ../main.c ../util.c -o prog$ objcopy --only-keep-debug prog prog.debug$ objcopy --strip-debug --add-gnu-debuglink=prog.debug prog prog.stripped$ printf x >> prog.debugPredict gdb -q -batch -iex "set verbose on" -ex "info line add" ./prog.stripped. Repair acceptance by changing only the executable. Would the same repair detect a companion from an unrelated build?
Answers
1. Expanded offsets and generated names
Stored size is 0x91 = 145; expanded size is 0xea = 234, alignment 1. Offset 0xcb is valid in the expanded data. The linker must decompress first. This is why the section's compressed file bytes cannot be relocated in place.
The combined GCC command generates:
$ lssp2sp2-main.dwosp2-util.dwo$ readelf --debug-dump=info sp2 | grep -E "dwo_name" <29> DW_AT_dwo_name : (indirect string, offset: 0): sp2-main.dwo <5e> DW_AT_dwo_name : (indirect string, offset: 0x2d): sp2-util.dwoThe DWO names include the output basename: sp2-main.dwo and sp2-util.dwo. Temporary ordinary objects disappear after linking. A packaging script that assumes source.dwo would miss these companions.
2. State-machine arithmetic
04 00 selects file zero. The extended set-address operation establishes 0x201170. 03 0a adds ten lines, then copy emits line 11. Special opcode 21 has adjusted value 20: address +1, line +1. bb has adjusted value 174: address +12, line +1. 91 has adjusted value 132: address +9, line +1. The final advance adds two bytes, and end-sequence emits the closing row:
0x0000000000201170 11 0 0 0 0 0 is_stmt0x0000000000201171 12 13 0 0 0 0 is_stmt prologue_end0x000000000020117d 13 5 0 0 0 0 is_stmt0x0000000000201186 14 1 0 0 0 0 is_stmt epilogue_begin0x0000000000201188 14 1 0 0 0 0 is_stmt end_sequenceThe other operations set columns or flags without emitting rows. llvm-dwarfdump --debug-line -v exposes the same byte-by-byte interpretation.
The compression header says zlib, reserved field zero, expanded size 0xb1fa = 45562, alignment 1. Compressed payload is 0x66c1 - 24 = 26281 bytes, or about 57.7%. The complete debug payload compresses better because several other sections contain more repetitive structures.
3. A checksum checks the file you named
GDB finds the companion but rejects its changed CRC:
$ gdb -q -batch -iex "set verbose on" -ex "info line add" ./prog.strippedReading symbols from ./prog.stripped...
warning: the debug information found in "<work>/gdb/ex/prog.debug" does not match "<work>/gdb/ex/prog.stripped" (CRC mismatch).
(No debugging symbols found in ./prog.stripped)No line number information available for address 0x1187 <add>The ordinary symbol table still provides add's name. Remove the old debuglink and recreate it against the modified file:
$ objcopy --remove-section=.gnu_debuglink prog.stripped$ objcopy --add-gnu-debuglink=prog.debug prog.stripped$ gdb -q -batch -iex "set verbose on" -ex "info line add" ./prog.strippedReading symbols from ./prog.stripped...Reading symbols from <work>/gdb/ex/prog.debug...Line 1 of "../util.c" starts at address 0x1187 <add> and ends at 0x1195 <add+14>.GDB now accepts it. The checksum certifies that the file matches the bytes used when the debuglink was created; it does not certify common provenance. The recorded counterexample rebuilds a different source file and installs its debug companion under the expected name:
$ readelf -n prog.stripped other | grep "Build ID" Build ID: eb34c618b304e7bb6e1a92866e1040e6c6855b0c Build ID: 4b9a607eb14d7dd3d457ab5051cbc16e4ca4a56f$ gdb -q -batch -iex "set verbose on" -ex "info line add" ./prog.strippedReading symbols from ./prog.stripped...Reading symbols from <work>/gdb/mm/prog.debug...Line 1 of "util2.c" starts at address 0x1187 <add> and ends at 0x1195 <add+14>.The build IDs differ, yet this debuglink path accepts the new CRC and reports util2.c. A build-ID-based artifact store associates files by the original build identity. Preserve that association rather than “repairing” checksums around an unknown mismatch.
Appendix: terms and tools
-
Section GC, section garbage collection, retains sections reachable from the entry and other roots and discards unused sections during linking. It is distinct from runtime heap garbage collection. GNU ld options. ↩
-
Clang provides C-family language frontends and a compiler driver within the LLVM project. It commonly uses an integrated assembler; linker selection still depends on the target and configuration. Clang toolchain documentation. ↩
-
DWARF is a debugging-information format describing source lines, types, variables, and machine locations. It can be carried in ELF, but is not the ELF symbol table. Specification. ↩
-
DIE, Debugging Information Entry, is a DWARF record describing an entity such as a compilation unit, function, type, or variable. Attributes and references organize these records into debug information. DWARF 5. ↩
-
LLD is LLVM's linker. ELF tools commonly invoke it as
ld.lld;lld-linkprovides a Windows-compatible interface. LLD. ↩ -
ICF, Identical Code Folding, merges code judged equivalent. Matching bytes alone may be insufficient: relocation targets, observable function addresses, and associated runtime metadata also matter. LLD. ↩
-
LLVM names a collection of compiler and toolchain projects, including optimization and code-generation infrastructure. Clang, LLD, and LLVM IR are related but have different roles. LLVM. ↩
-
xv6 is MIT's small Unix-style teaching operating system. The series uses its RISC-V version to examine the handoff from ELF files to processes. Source. ↩
-
RISC-V is an open instruction-set architecture. The core course builds a linker on native x86-64 Linux; RV64 appears in architecture comparisons and kernel examples. Use the RISC-V psABI for those examples rather than applying x86-64 encodings or relocation rules. ↩